Graph Symptoms Over Time

NovoPsych graphs symptoms over time so you can visually monitor symptoms changing from session to session.
The Depression Anxiety and Stress Scale (DASS-21) and the Kessler Psychological Distress Scale (K10) are two of the most used assessments on NovoPsych. If a client is administered these tests more than once, the results will be automatically graphed – a handy feature for providing feedback to clients or to include in letters back to referrers. Practitioners generally administer these assessments at session one, three and six, and monthly thereafter.
DASS-21
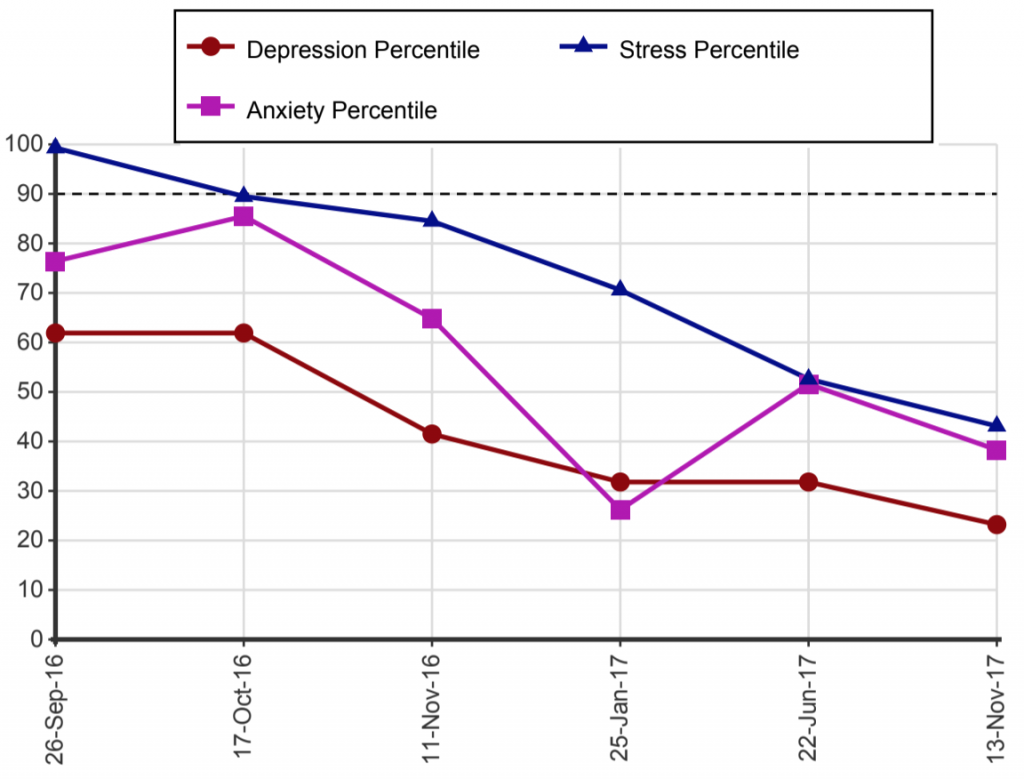
In the example below the DASS-21 results show reduced symptoms over time. On the Y axis is the percentile rank derived from a community normative sample, indicating how this individual scored in comparison to the general population. The graph shows scores on the 99th percentile for Stress on first administration, with symptoms reducing over time. The 50th percentile indicates that this person experienced symptoms no more or less than the average person in the community, while percentile scores above 90 indicate clinically significant symptoms.

Routinely measuring clinical outcomes offers significant benefits to psychologists and clients. Use of outcome measures can guide treatment decisions and help clients recognise their own improvements. In fact, research shows that regular use of outcome measures may increase engagement and improve the therapeutic relationship, thereby increasing the efficacy of treatment. Of course, measures are particularly meaningful to clients if feedback is provided in a clear manner. Indeed, graphing symptoms over time gives clients an objective representation of their distress and may provide personalised evidence of the benefits of treatment.
Referrer Letter Graphs
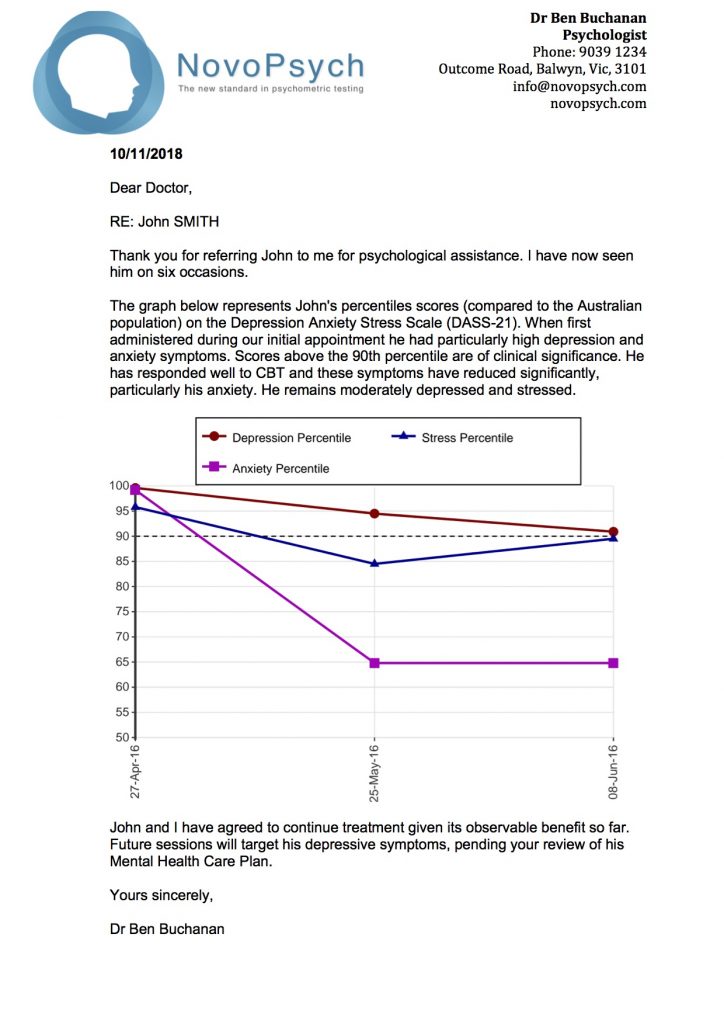
Graphs are particularly helpful when writing to referring doctors, giving doctors an objective sense of the benefit of treatment. The letter below shows how you can demonstrate the client’s mental state over the course of treatment. Including graphs saves you time and clearly communicates with referrers! Win Win!

Long Term Treatment
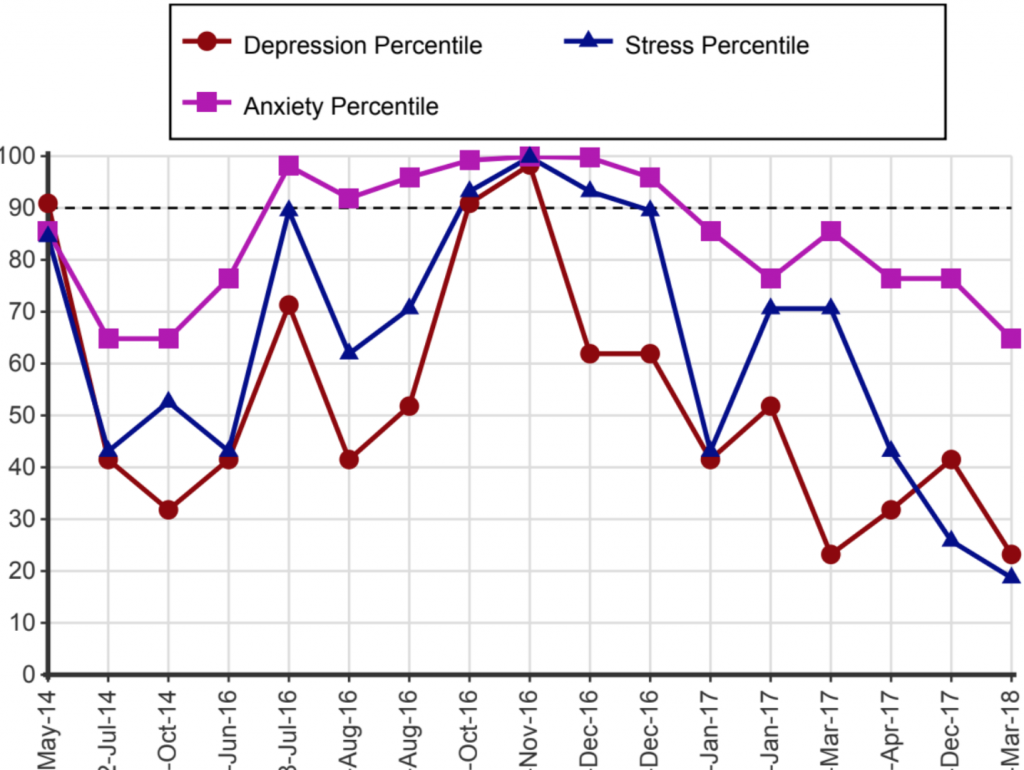
Graphing symptoms over time can be particularly useful for longer term treatment, so that clients can see the impact of triggers, be reminded that they can improve, and learn about their mood cycles. The graph below show a long term (4 year) course of therapy. Using graphs clinicians can identify the life conditions that are conducive to well-being, and those that cause stress.

