The Life Orientation Test-Revised (LOT-R; Scheier, Carver, & Bridges, 1994) is a 10-item self-report instrument designed to assess dispositional optimism, conceptualised as generalised positive expectancies about future outcomes. The scale represents a refinement of the original Life Orientation Test (Scheier & Carver, 1985), with modifications addressing item content issues and better distinguishing optimism from related constructs like neuroticism and self-mastery. The LOT-R is suitable for individuals aged 14 years and above, demonstrating broad applicability across the lifespan from adolescence through late adulthood.
Dispositional optimism, as measured by the LOT-R, reflects a stable personality trait characterised by the tendency to expect positive outcomes and maintain hopeful perspectives regarding future events. This construct is theoretically grounded in expectancy-value models of motivation, wherein optimistic beliefs lead individuals to approach challenges with persistence and engagement, while pessimistic orientations are associated with withdrawal and disengagement from goal-directed efforts (Scheier & Carver, 1985; Scheier, Carver, & Bridges, 2001).
Example LOT-R Item

The scale consists of two subscales:
Research has consistently demonstrated that dispositional optimism correlates with numerous adaptive outcomes. Higher optimism scores are associated with enhanced psychological wellbeing, reduced depression and anxiety, better physical health outcomes, improved health behaviours, decreased mortality risk, and more successful recovery following surgery or severe illness (Giltay et al., 2004; Kivimäki et al., 2005; Rasmussen et al., 2009). The relationship between optimism and life satisfaction is particularly robust and has been observed across multiple studies (Glaesmer et al., 2012; Hinz et al., 2017).
In clinical practice, the LOT-R serves multiple functions. It assists in identifying individuals’ characteristic thinking patterns that may influence treatment engagement and therapeutic outcomes. For instance, patients with lower optimism scores may benefit from cognitive interventions targeting pessimistic thinking patterns, while those with extremely high optimism might require support in developing more realistic appraisals when facing serious health challenges. Additionally, the LOT-R can be used to monitor changes in hopeful thinking as both a therapeutic process variable and outcome measure, providing clinicians with insights into cognitive shifts occurring during treatment.
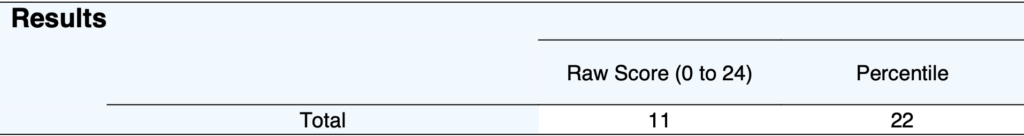
The scale yields a total score ranging from 0-24. Higher scores indicate greater dispositional optimism. Subscale scores range from 0-12 and are listed below:
The remaining four items serve as fillers to obscure the scale’s purpose. The total score provides a global index of optimistic orientation, while subscale scores offer information about the presence of positive expectancies versus the absence of negative expectancies. Examining subscale patterns can be clinically informative. For instance, individuals may show high optimism with moderate pessimism, suggesting coexisting positive and negative future expectancies.

Percentile ranks based on population norms facilitate clinical interpretation. Using data from Hinz et al. (2017), a total score of 16 corresponds to the 50th percentile in the general population. Scores below 13 (approximately 30th percentile) may indicate lower than typical optimism warranting clinical attention, while scores above 19 (approximately 75th percentile) suggest notably high optimism. However, extremely high scores may occasionally reflect unrealistic optimism associated with risk-taking behaviours (Hmieleski & Baron, 2009).
On first administration, a bar graph of the total percentile is shown.
When administered more than once, a line graph plotting the total percentile over time is shown.
The LOT-R demonstrates robust psychometric properties across diverse populations and cultural contexts. Construct validity is well-established through appropriate correlations with theoretically related constructs. The scale shows negative correlations with depression (r = -.31 to -.32), anxiety (r = -.22), and neuroticism (r = -.36 to -.43), while demonstrating positive correlations with self-mastery (r = .48 to .60), self-esteem (r = .50), and sense of coherence (r = .58) (Chiesi et al., 2013; Glaesmer et al., 2012; Scheier et al., 1994). These patterns support both convergent and discriminant validity.
Internal consistency of the LOT-R is acceptable though modest, with Cronbach’s alpha values typically ranging from α = .66 to .82 across studies. Specifically, Scheier et al. (1994) reported α = .78 in their original validation, while population-based studies have found α = .68 (Glaesmer et al., 2012) and α = .66 (Hinz et al., 2017) for the total score. The subscales show similar reliability: optimism (α = .70) and pessimism (α = .63-.74). Test-retest reliability demonstrates reasonable temporal stability, with correlations of r = .68 at 4 months, r = .60 at 12 months, r = .56 at 24 months, and r = .79 at 28 months (Scheier et al., 1994).
Factor analytic studies have consistently supported a two-factor structure, with optimism and pessimism emerging as separate but negatively correlated factors. Confirmatory factor analyses across multiple large samples demonstrate superior fit for the bi-dimensional model compared to a unidimensional structure (Glaesmer et al., 2012; Herzberg, Glaesmer, & Hoyer, 2006; Hinz et al., 2017). The correlation between optimism and pessimism subscales varies considerably, typically ranging from r = -.20 to -.29, suggesting they represent related but distinct constructs rather than opposite poles of a single dimension. Notably, this correlation appears moderated by age and education, with younger and more educated samples showing stronger negative correlations (up to r = -.50 in young adults) compared to older adults (r = .05 in those ≥70 years) (Hinz et al., 2017).
Item Response Theory analyses conducted by Chiesi et al. (2013) provide additional evidence for the scale’s measurement precision. All items demonstrated high discriminative power (α = 1.29 to 2.04 logits), effectively distinguishing between individuals at different trait levels. The test information function indicated that the LOT-R provides reliable measurement across a broad range of the latent trait, particularly from -3.00 to +1.80 standard deviations, though precision decreases at extremely high optimism levels.
Extensive normative data are available from population-based studies. Hinz et al. (2017) reported norms from 9,711 German adults (M = 16.2, SD = 3.8 for total score), while Glaesmer et al. (2012) provided data from 2,372 adults aged 18-93 (M = 15.2, SD = 3.8). These studies found minimal gender differences (effect sizes d < .12) and modest age effects, with younger adults showing slightly higher optimism. Educational attainment showed stronger associations, with more educated individuals reporting higher optimism (d = .44) and lower pessimism (d = .48).
Measurement invariance analyses support the scale’s use across demographic groups. Hinz et al. (2017) confirmed metric invariance across gender and age groups, though scalar invariance was only partially supported. This indicates that while the LOT-R measures the same constructs across groups, some caution is warranted when making direct mean comparisons between demographic categories.
Dispositional optimism is a stable personality trait reflecting generalised positive expectancies about future outcomes. It’s not just about “looking on the bright side” but represents a fundamental way people approach life’s challenges. Research shows that higher optimism is associated with better psychological wellbeing, reduced depression and anxiety, improved physical health outcomes, better recovery from surgery or illness, and even decreased mortality risk. The LOT-R helps identify whether someone tends to expect positive outcomes (optimism) or negative outcomes (pessimism), which can significantly influence how they cope with stress, engage with treatment, and persist through difficulties.
The LOT-R serves multiple clinical functions. At assessment, it helps identify thinking patterns that may influence treatment engagement and outcomes. The scale can be administered regularly throughout treatment to monitor cognitive shifts. Clinically, scores below the 30th percentile (under 13) may indicate problematic pessimism warranting intervention, while scores above the 75th percentile (over 19) suggest notably high optimism. However, extremely high scores occasionally reflect unrealistic optimism that might be associated with risk-taking behaviours. The measure is particularly useful for identifying patients who might benefit from cognitive interventions targeting pessimistic thinking patterns or those who need support developing more realistic appraisals when facing serious health challenges.
Research consistently shows that optimism and pessimism are related but distinct constructs rather than opposite ends of a single continuum. The correlation between the two subscales varies considerably. and this relationship changes with age and education. Younger adults show stronger negative correlations between optimism and pessimism, while in older adults (over 70 years) the two can be almost independent. This means someone can simultaneously hold both positive and negative expectancies about the future. For example, a person might generally expect good things to happen (high optimism) while also worrying about specific negative outcomes (moderate pessimism). Understanding this pattern provides richer clinical information than a single score would offer.
Higher dispositional optimism consistently predicts better treatment engagement and outcomes across various health conditions. Optimistic individuals tend to approach challenges with persistence and active coping strategies, while those with pessimistic orientations may withdraw from goal-directed efforts. In therapy, patients with low optimism scores often benefit from cognitive interventions that challenge negative expectancy patterns and build more balanced future-focused thinking. The LOT-R can track whether these interventions are shifting cognitive patterns over time. Importantly, the goal isn’t always to maximise optimism scores; for some patients facing serious health challenges, developing realistic appraisals that balance hope with practical planning may be more adaptive than unrealistic optimism.
Age influences both optimism levels and the relationship between optimism and pessimism. Younger adults typically show slightly higher optimism scores and a stronger negative correlation between optimism and pessimism subscales, meaning their positive and negative expectancies tend to be more mutually exclusive. In contrast, older adults show weaker correlations between the subscales, suggesting they can hold positive and negative expectancies simultaneously without conflict. Educational attainment shows even stronger effects than age, with more educated individuals reporting higher optimism and lower pessimism. While the LOT-R demonstrates measurement invariance across age groups (measuring the same constructs), these demographic patterns should inform clinical interpretation, particularly when comparing scores across different populations or tracking changes over the lifespan.
Scheier, M.F., Carver, C.S., & Bridges, M.W. (1994). Distinguishing Optimism From Neuroticism (and Trait Anxiety, Self-Mastery, and Self-Esteem): A Reevaluation of the Life Orientation Test. Journal of Personality and Social Psychology, 67(6), 1063-1078.
Chiesi, F., Galli, S., Primi, C., Innocenti Borgi, P., & Bonacchi, A. (2013). The accuracy of the Life Orientation Test-Revised (LOT-R) in measuring dispositional optimism: Evidence from item response theory analyses. Journal of Personality Assessment, 95(5), 523-529. https://doi.org/10.1080/00223891.2013.781029
Giltay, E. J., Geleijnse, J. M., Zitman, F. G., Hoekstra, T., & Schouten, E. G. (2004). Dispositional optimism and all-cause and cardiovascular mortality in a prospective cohort of elderly Dutch men and women. Archives of General Psychiatry, 61(11), 1126-1135. https://doi.org/10.1001/archpsyc.61.11.1126
Glaesmer, H., Rief, W., Martin, A., Mewes, R., Brähler, E., Zenger, M., & Hinz, A. (2012). Psychometric properties and population-based norms of the Life Orientation Test Revised (LOT-R). British Journal of Health Psychology, 17(2), 432-445. https://doi.org/10.1111/j.2044-8287.2011.02046.x
Herzberg, P. Y., Glaesmer, H., & Hoyer, J. (2006). Separating optimism and pessimism: A robust psychometric analysis of the revised Life Orientation Test (LOT-R). Psychological Assessment, 18(4), 433-438. https://doi.org/10.1037/1040-3590.18.4.433
Hinz, A., Sander, C., Glaesmer, H., Brähler, E., Zenger, M., Hilbert, A., & Kocalevent, R. D. (2017). Optimism and pessimism in the general population: Psychometric properties of the Life Orientation Test (LOT-R). International Journal of Clinical and Health Psychology, 17(2), 161-170. https://doi.org/10.1016/j.ijchp.2017.02.003
Hmieleski, K. M., & Baron, R. A. (2009). Entrepreneurs’ optimism and new venture performance: A social cognitive perspective. Academy of Management Journal, 52(3), 473-488. https://doi.org/10.5465/amj.2009.41330755
Kivimäki, M., Vahtera, J., Elovainio, M., Helenius, H., Singh-Manoux, A., & Pentti, J. (2005). Optimism and pessimism as predictors of change in health after death or onset of severe illness in family. Health Psychology, 24(4), 413-421. https://doi.org/10.1037/0278-6133.24.4.413
Rasmussen, H. N., Scheier, M. F., & Greenhouse, J. B. (2009). Optimism and physical health: A meta-analytic review. Annals of Behavioral Medicine, 37(3), 239-256. https://doi.org/10.1007/s12160-009-9111-x
Scheier, M. F., & Carver, C. S. (1985). Optimism, coping, and health: Assessment and implications of generalized outcome expectancies. Health Psychology, 4(3), 219-247. https://doi.org/10.1037/0278-6133.4.3.219
Scheier, M. F., Carver, C. S., & Bridges, M. W. (1994). Distinguishing optimism from neuroticism (and trait anxiety, self-mastery, and self-esteem): A reevaluation of the Life Orientation Test. Journal of Personality and Social Psychology, 67(6), 1063-1078. https://doi.org/10.1037/0022-3514.67.6.1063
Scheier, M. F., Carver, C. S., & Bridges, M. W. (2001). Optimism, pessimism, and psychological well-being. In E. C. Chang (Ed.), Optimism & pessimism: Implications for theory, research, and practice (pp. 189-216). American Psychological Association.